This article is one in a long series which I hope will help explain the ins and outs of DFA – Dimensional Fund Advisors. NOTE: This is my interpretation and explanation only. For the final word, please refer to the DFA Canada Website.
The Problem With CAPM
A quote taken from a piece written by Eugene F. Fama, Jr (son of the researcher Dr. Eugene Fama, Sr):
“The single-factor model (CAPM) is grounded in an elegant theory. The rationale is sensible. It’s a great model in every respect except for the fact that it doesn’t work. It did a decent job when the world of investments was mostly managed versions of the market, but the further the portfolios got from the market, the less the model explained their returns.”
What is being said here is that CAPM does a poor job explaining the variability in returns when a portfolio is too different from the broad market. I think the best way to explain this is with hard data.
Dissecting The Market
First of all, we need to be clear that the data is regarding the US stock markets in US dollars. We’ll discuss other markets (i.e. Canada) in due course. Fama and French looked at many ways to dissect the market in order to find other factors that lead to higher returns – two factors they identified were Size and Value, but let’s see why they think these are additional factors over and above the market factor.
The Size Factor
The chart below is the US stock market which consists of all stocks in the NYSE, NASDAQ and AMEX except for ADRs, closed-end funds and tracking stocks from July 1926 to December 2006. The ‘market’ portfolio is all stocks that fit this criteria. The ‘large’ portfolio is composed of stocks with market caps in the top 30% of NYSE market cap. The ‘small’ portfolio is composed of stocks with market caps in the bottom 30% of NYSE market cap. The performance shown is the annualized average of the monthly rates of return and is originally sourced from Fama & French’s research.
You’ll note that Small cap stocks outperformed Large cap stocks quite handily. The difference in this case is an annualized average of 4.69% and is a statistically significant result (i.e. not due to chance according to the data).
The Book-to-Market Factor (Value Factor)
I suppose I should avoid calling this the “value” factor where possible since calling it that is a bit of a misnomer. For the most part, investors today relate “value” as stocks that are temporarily mis-priced by the market and you’ll see that the data does not actually support such a notion. This is one of the areas which will seem to contradict conventional wisdom (i.e. that value stocks are less risky than growth stocks).
First we need to define Book-to-market. This is simply the Book Value of a stock versus the Market Value of a stock. Book value is like the accountant’s estimate of the value of a company based on assets minus liabilities and market value is just the overall market capitalization as determined by the stock price. So if a stock is trading at a low price, than the ratio of Book value to Market value is higher – and this indicates a “value” stock. If a stock is trading at a higher price, than the ratio of Book value to Market value is lower – this indicates more of a “growth” stock. For the purposes of explanation, I will use value and high book to market interchangeably, and growth and low book to market interchangeably.
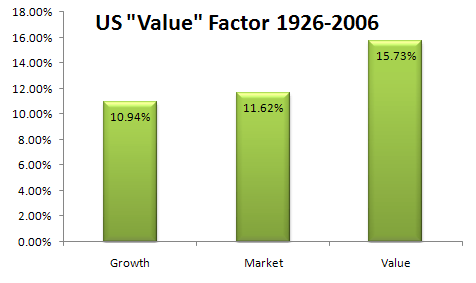
The chart below shows the annualized average rates of return for the market versus ‘value’ (or ‘high book to market’) stocks and ‘growth’ (or ‘low book to market’) stocks, again based on monthly rates of return from July 1926 to December 2006. Value stocks are identified as stocks with positive BtM’s in the top 30% of NYSE BtM distributions and Growth stocks are identified as stocks with positive BtM’s in the bottom 30% of NYSE BtM distributions.
This time we see that Value stocks handily outperformed growth stocks by an annualized average of 4.79%, which is again reliably different from zero (i.e. not due to chance).
To Be Continued…
We’re not done yet. While we have looked at 80 years of data to see that small stocks outperform large stocks and value outperforms growth, there is more data to sift through before we look at the model that Fama and French proposed that is now known as the Fama-French Three Factor Model, which has significantly more explanatory power than CAPM. You’ll remember that CAPM was a one factor model (it looked at exposure to the market factor). The FFTFM (Fama French Three Factor Model) essentially looks at exposure to the market factor, exposure to the size factor and exposure to the value factor – hence the name.


The obvious question: what about small, value stocks? If size and B/M are independent, would we expect small, value stocks to outperform the market by 9%?
Are the returns in your bar charts arithmetic average returns or compound average returns? If we are to believe CAPM, then small stocks are more volatile than large stocks, and value stocks are more volatile than growth stocks. Do you have stats on the volatilities to go with the return data?
@Patrick – good question, and I will provide a further dissection which will help address that (along with some commentary).
@Michael James – 95% sure these are compounded (although I will double check with the data at home and revise and let you know if otherwise). You are indeed correct in that the small and value are more volatile and I will post the numbers in the next part in the series. I was going to put the SD numbers in, but wanted to address them more fully and the post was getting too long.